The biggest shock of my early career was just how much code I needed to read that others wrote. I had never dealt with this. I had a hard enough time understanding my own code. The idea of understanding hundreds of thousands or even millions of lines of code written by countless other people scared me. What I quickly learned is that you don't have to understand a codebase in its entirety to be effective in it. But just saying that is not super helpful. So rather than tell, I want to show.
In this post, I'm going to walk you through how I learn an unfamiliar codebase. But I'll admit, this isn't precisely how I would do it today. After years of working on codebases, I've learned quite a lot of shortcuts. Things that come with experience that just don't translate for other people. So what I'm going to present is a reconstruction. I want to show bits and parts of how I go from knowing very little to gaining knowledge and ultimately, asking the right questions.
To do this, I will use just a few techniques:
- Setting a goal
- Editing randomly
- Fixing things I find that are broken
- Reading to answer questions
- Making a visualizer
I want to do this on a real codebase, so I've chosen one whose purpose and scope I'm generally familiar with. But one that I've never contributed to or read, Next.js. But I've chosen to be a bit more particular than that. I'm particularly interested in learning more about the Rust bundler setup (turbopack) that Next.js has been building out. So that's where we will concentrate our time.
Being Clear About Our Goal#
Trying to learn a codebase is distinctly different from trying to simply fix a bug or add a feature. In post, we may use bugs, talk about features, make changes, etc. But we are not trying to contribute to the codebase, yet. Instead, we are trying to get our mind around how the codebase generally works. We aren't concerned with things like coding standards, common practices, or the development roadmap. We aren't even concerned with correctness. The changes we make are about seeing how the codebase responds so we can make sense of it.
Starting Point#
I find starting at main to be almost always completely unhelpful. From main, yes, we have a single entry point, but now we are asking ourselves to understand the whole. But things actually get worse when dealing with a large codebase like this. There isn't even one main. Which main would we choose? So instead, let's start by figuring out what our library even consists of.
❯ ls -1d */
apps/
bench/
contributing/
crates/
docs/
errors/
examples/
packages/
patches/
rspack/
scripts/
test-config-errors/
test/
turbo/
turbopack/
A couple of things to note. We have packages, crates, turbo, and turbopack. Crates are relevant here because we know we are interested in some of the Rust code, but we are also interested in turbopack in particular. A quick look at these shows that turbo, packages, and crates are probably not our target. Why do I say that? Because turbopack has its own crates folder.
❯ ls -d turbopack/crates/* | wc -l
      54
So there are 54 crates under turbopack.... This is beginning to feel a bit daunting. So why don't we take a step back and find a better starting point? One starting point I find particularly useful is a bug report.
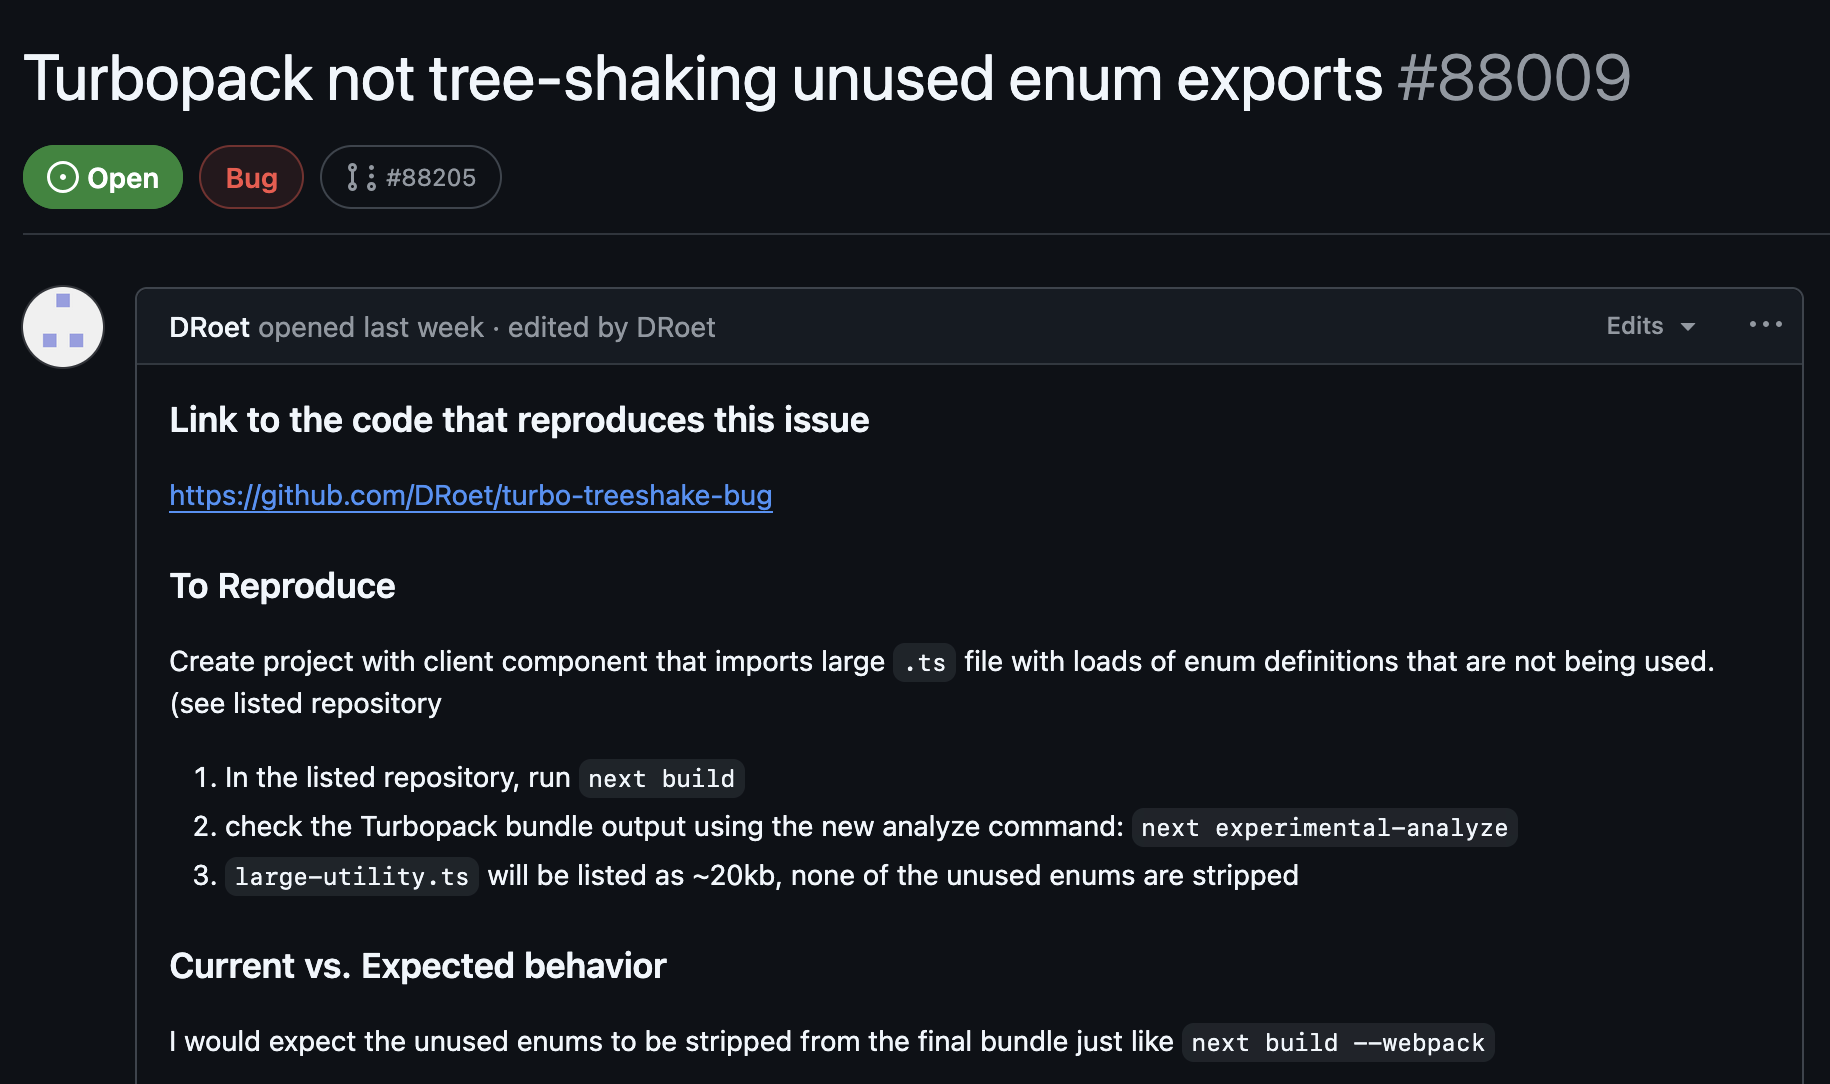
I found this by simply looking at recently opened issues. When I first found it, it had no comments on it. In fact, I find bug reports with only reproducing instructions to be the most useful. Remember, we are trying to learn, not fix a bug.
So I spent a little time looking at the bug report. It is fairly clear. It does indeed reproduce. But it has a lot of code. So, as is often the case, it is useful to reduce it to the minimal case. So that's what I did. Here is the important code and the problem we are using to learn from.
// app.ts
import { greeting } from './utility'

export default function Home() {
  return (
    <div>${"greeting"} World</div>
  );
}
// utility.ts
export enum MyEnum {
  UNIQUE_1 = 'UNIQUE_1',
  UNIQUE_2 = 'UNIQUE_2',
}

export const greeting = "Hello";
MyEnum here is dead code. It should not show up in our final bundle. But when we do next build and look for it, we get:
❯ rg --no-ignore --hidden -g '!*.map' UNIQUE_1
app/utility.ts
2: UNIQUE_1 = 'UNIQUE_1',

.next/server/chunks/ssr/[root-of-the-server]__5f0b8324._.js
1:module.exports=[93695,(a,b,c)=>{b.exports=a.x("next/dist/shared/lib/...
If we instead do next build --webpack
❯ rg --no-ignore --hidden -g '!*.map' UNIQUE_1
app/utility.ts
2: UNIQUE_1 = 'UNIQUE_1',
The code is completely gone from our build.
Setting an Agenda#
So now we have our bug. But remember. Our goal here is not to fix the bug. But to understand the code. So our goal is going to be to use this little mini problem to understand what code is involved in this bug. To understand the different ways we could fix this bug. To understand why this bug happened in the first place. To understand some small slice of the turbopack codebase.
So at each junction, we are going to resist the urge to simply find the offending code. We are going to take detours. We are going to ask questions. We hope that from the start of this process to the end, we no longer think of the code involved in this action as a black box. But we will intentionally leave ourselves with open questions. As I write these words, I have no idea where this will take us. I have not prepared this ahead of time. I am not telling you a fake tale from a codebase I already know. Yes, I will simplify and skip parts. But you will come along with me.
Finding Tree Shaking#
The first step for understanding any project is getting some part of it running. Well, I say that, but in my day job, I've been at companies where this is a multi-day or week-long effort. Sometimes, because of a lack of access, sometimes from unclear instructions, if you find yourself in that situation, you now have a new task, understand it well enough to get it to build. Well, unfortunately, that is the scenario we find ourselves in.
The First Side Quest#
I can't think of a single one of these endeavors I've gone on to learn a codebase that didn't involve a completely undesirable, momentum-stopping side quest. For this one, it was as soon as I tried to make changes to the turbopack Rust code and get it working in my test project. There are instructions on how to do this. In fact, we even get an explanation on why it is a bit weird.
Since Turbopack doesn't support symlinks when pointing outside of the workspace directory, it can be difficult to develop against a local Next.js version. Neither
pnpm linknorfile:imports quite cut it. An alternative is to pack the Next.js version you want to test into a tarball and add it to the pnpm overrides of your test application. The following script will do it for you:pnpm pack-next --tar && pnpm unpack-next path/to/project
Okay, straightforward enough. I start by finding somewhere in the turbopack repo that I think will be called more than once, and I add the following:
diff --git a/turbopack/crates/turbopack/src/lib.rs b/turbopack/crates/turbopack/src/lib.rs
index 20891acf86..8691f1951c 100644
--- a/turbopack/crates/turbopack/src/lib.rs
+++ b/turbopack/crates/turbopack/src/lib.rs
@@ -80,6 +80,7 @@ async fn apply_module_type(
     css_import_context: Option<ResolvedVc<ImportContext>>,
     runtime_code: bool,
 ) -> Result<Vc<ProcessResult>> {
+ println!("HERERE!!!!!!!");
     let tree_shaking_mode = module_asset_context
         .module_options_context()
         .await?
Yes. Very scientific, I know. But I've found this to be a rather effective method of making sure my changes are picked up. So I do that, make sure I've built and done the necessary things. I run
pnpm swc-build-native && pnpm pack-next --tar && pnpm unpack-next /path/to/test/project
Then that script tells me to add some overrides and dependencies to my test project. I go to build my project and HERERE!!!!!!! does not show up at all...
Understanding the Build System#
I will save you the fun details here of looking through this system. But I think it's important to mention a few things. First, @next/swc being a dependency immediately stood out to me. In my day job, I maintain a fork of swc (WHY???) for some custom stuff. I definitely won't pretend to be an expert on swc, but I know it's written in Rust. I know it's a native dependency. The changes I'm making are native dependencies. But I see no mention at all of turbopack. In fact, if I search in my test project, I get the following:
❯ fd --no-ignore swc
node_modules/@next/swc

❯ fd --no-ignore turbopack
# empty
So I have a sneaking suspicion my turbopack code should be in that tar. So let's look at the tar.
❯ du -h next-swc.tar
12k
Ummm. That seems a bit small... Let's look at what's inside.
❯ tar -tf next-swc.tar
./README.md
./package.json
Okay, I think we found our problem. There's really nothing in this at all. Definitely no native code.
Regex - Now You Have Two Problems#
After lots of searching, the culprit came down to:
const packageFiles = [...globbedFiles, ...simpleFiles].sort()
const set = new Set()
return packageFiles.filter((f) => {
  if (set.has(f)) return false
  // We add the full path, but check for parent directories too.
  // This catches the case where the whole directory is added
  // and then a single file from the directory.
  // The sorting before ensures that the directory comes before
  // the files inside of the directory.
  set.add(f)
  while (f.includes('/')) {
    f = f.replace(/\/[^/]+$/, '')
    if (set.has(f)) return false
  }
  return true
})
In our case, the input came from this file and f was "native/". Unfortunately, this little set + regex setup causes native/ to be filtered out. Why? Because it doesn't match the regex. This regex is looking for a / with characters after it. We have none. So since we are already in the set (we just added ourselves), we filter ourselves out.
How do we solve this problem? There are countless answers, really. I had Claude whip me up one without regex.
const packageFiles = [...globbedFiles, ...simpleFiles].sort()
const set = new Set<string>()
return packageFiles.filter((f) => {
  const normalized = join(f)
  if (set.has(normalized)) return false
  set.add(normalized)
  let parent = dirname(normalized)
  while (parent !== '.' && parent !== '/') {
    if (set.has(parent)) return false
    parent = dirname(parent)
  }
  return true
})
But my gut says the sorting lets us do this much simpler. But after this fix, let's look at the tar now:
❯ tar -tf next-swc.tar
./README.md
./native/
./native/next-swc.darwin-arm64.node
./native/index.d.ts
./package.json
Much better. After this change, we can finally see HERERE!!!!!!! a lot.
Update: As I wrote this article, someone fixed this in a bit of a different way. Keeping the regex and just changing to *. Fairly practical decision.
For Real This Time?#
Okay, we now have something we can test. But where do we even begin? This is one reason we chose this bug. It gives a few avenues to go down. First, the report says that these enums are not being "tree-shaken." Is that the right term? One thing I've learned from experience is to never assume that the end user is using terms in the same manner as the codebase. So this can be a starting point, but it might be wrong.
With some searching around, we can actually see that there is a configuration for turning turbopackTreeShaking on or off.
const nextConfig: NextConfig = {
  experimental: {
    turbopackTreeShaking: true,
  },
};
It was actually a bit hard to find exactly where the default for this was. It isn't actually documented. So let's just enable it and see what we get.
> Build error occurred
Error [TurbopackInternalError]: Failed to write app endpoint /page

Caused by:
- index out of bounds: the len is 79 but the index is 79

Debug info:
- Execution of get_all_written_entrypoints_with_issues_operation failed
- Execution of EntrypointsOperation::new failed
- Execution of all_entrypoints_write_to_disk_operation failed
- Execution of Project::emit_all_output_assets failed
- Execution of *emit_assets failed
- Execution of all_assets_from_entries_operation failed
- Execution of *all_assets_from_entries failed
- Execution of output_assets_operation failed
- Execution of <AppEndpoint as Endpoint>::output failed
- Failed to write app endpoint /page
- Execution of AppEndpoint::output failed
- Execution of whole_app_module_graph_operation failed
- Execution of *ModuleGraph::from_single_graph failed
- Execution of *SingleModuleGraph::new_with_entries failed
- Execution of Project::get_all_entries failed
- Execution of <AppEndpoint as Endpoint>::entries failed
- Execution of get_app_page_entry failed
- Execution of *ProcessResult::module failed
- Execution of <ModuleAssetContext as AssetContext>::process failed
- Execution of EcmascriptModulePartAsset::select_part failed
- Execution of split_module failed
- index out of bounds: the len is 79 but the index is 79
Well, I think we figured out that the default is off. So one option is that we never "tree shake" anything. But that seems wrong. At this point, I looked into tree shaking a bit in the codebase, and while I started to understand a few things, I've been at this point before. Sometimes it is good to go deep. But how much of this codebase do I really understand? If tree shaking is our culprit (seeming unlikely at this point), it might be good to know how code gets there. Here, we of course found a bug. But it is an experimental feature. Maybe we can come back and fix it? Maybe we can file a bug? Maybe this code just isn't at all ready for primetime. It's hard to know as an outsider.
How a Chunk is Made#
Our "search around the codebase" strategy failed. So now we try a different tactic. We know a couple of things.
- Our utilities.ts file is read and parsed.
- It ends up in a file under a "chunks" directory.
We now have two points we can use to try to trace what happens. Let's start with parsing. Luckily, here it is straightforward: parse_file_content. When we look at this code, we can see that swc does the heavy lifting. First, it parses it into a TypeScript AST, then applies transforms to turn it into JavaScript. At this point, we don't write to a string, but if you edit the code and use an emitter, you see this:
export var MyEnum = /*#__PURE__*/ function(MyEnum) {
    MyEnum["UNIQUE_1"] = "UNIQUE_1";
    MyEnum["UNIQUE_2"] = "UNIQUE_2";
    return MyEnum;
}({});
export const greeting = "Hello!";
Now, to find where we write the chunks. In most programs, this would be pretty easy. Typically, there is a linear flow somewhere that just shows you the steps. Or if you can't piece one together, you can simply breakpoint and follow the flow. But Turbopack is a rather advanced system involving async Rust (more on this later). So, in keeping with the tradition of not trying to do things that rely too heavily on my knowledge, I have done the tried and true, log random things until they look relevant. And what I found made me realize that logging was not going to be enough. It was time to do my tried and true learning technique, visualization.
Building a Visualizer#
Ever since my first job, I have been building custom tools to visualize codebases. Perhaps this is due to my aphantasia. I'm not really sure. Some of these visualizers make their way into general use for me. But more often than not, they are a means of understanding. When I applied for a job at Shopify working on YJIT, I built a simple visualizer but never got around to making it more useful than a learning tool. The same thing is true here, but this time, thanks to AI, it looks a bit more professional.
This time, we want to give a bit more structure than what we'd be able to do with a simple print.1 We are trying to get events out that have a bunch of information. Mostly, we are interested in files and their contents over time. Looking through the codebase, we find that one key abstract is an ident; this will help us identify files. We will simply find points that seem interesting, make a corresponding event, make sure it has idents associated with it, and send that event over a WebSocket. Then, with that raw information, we can have our visualizer stitch together what exactly happens.
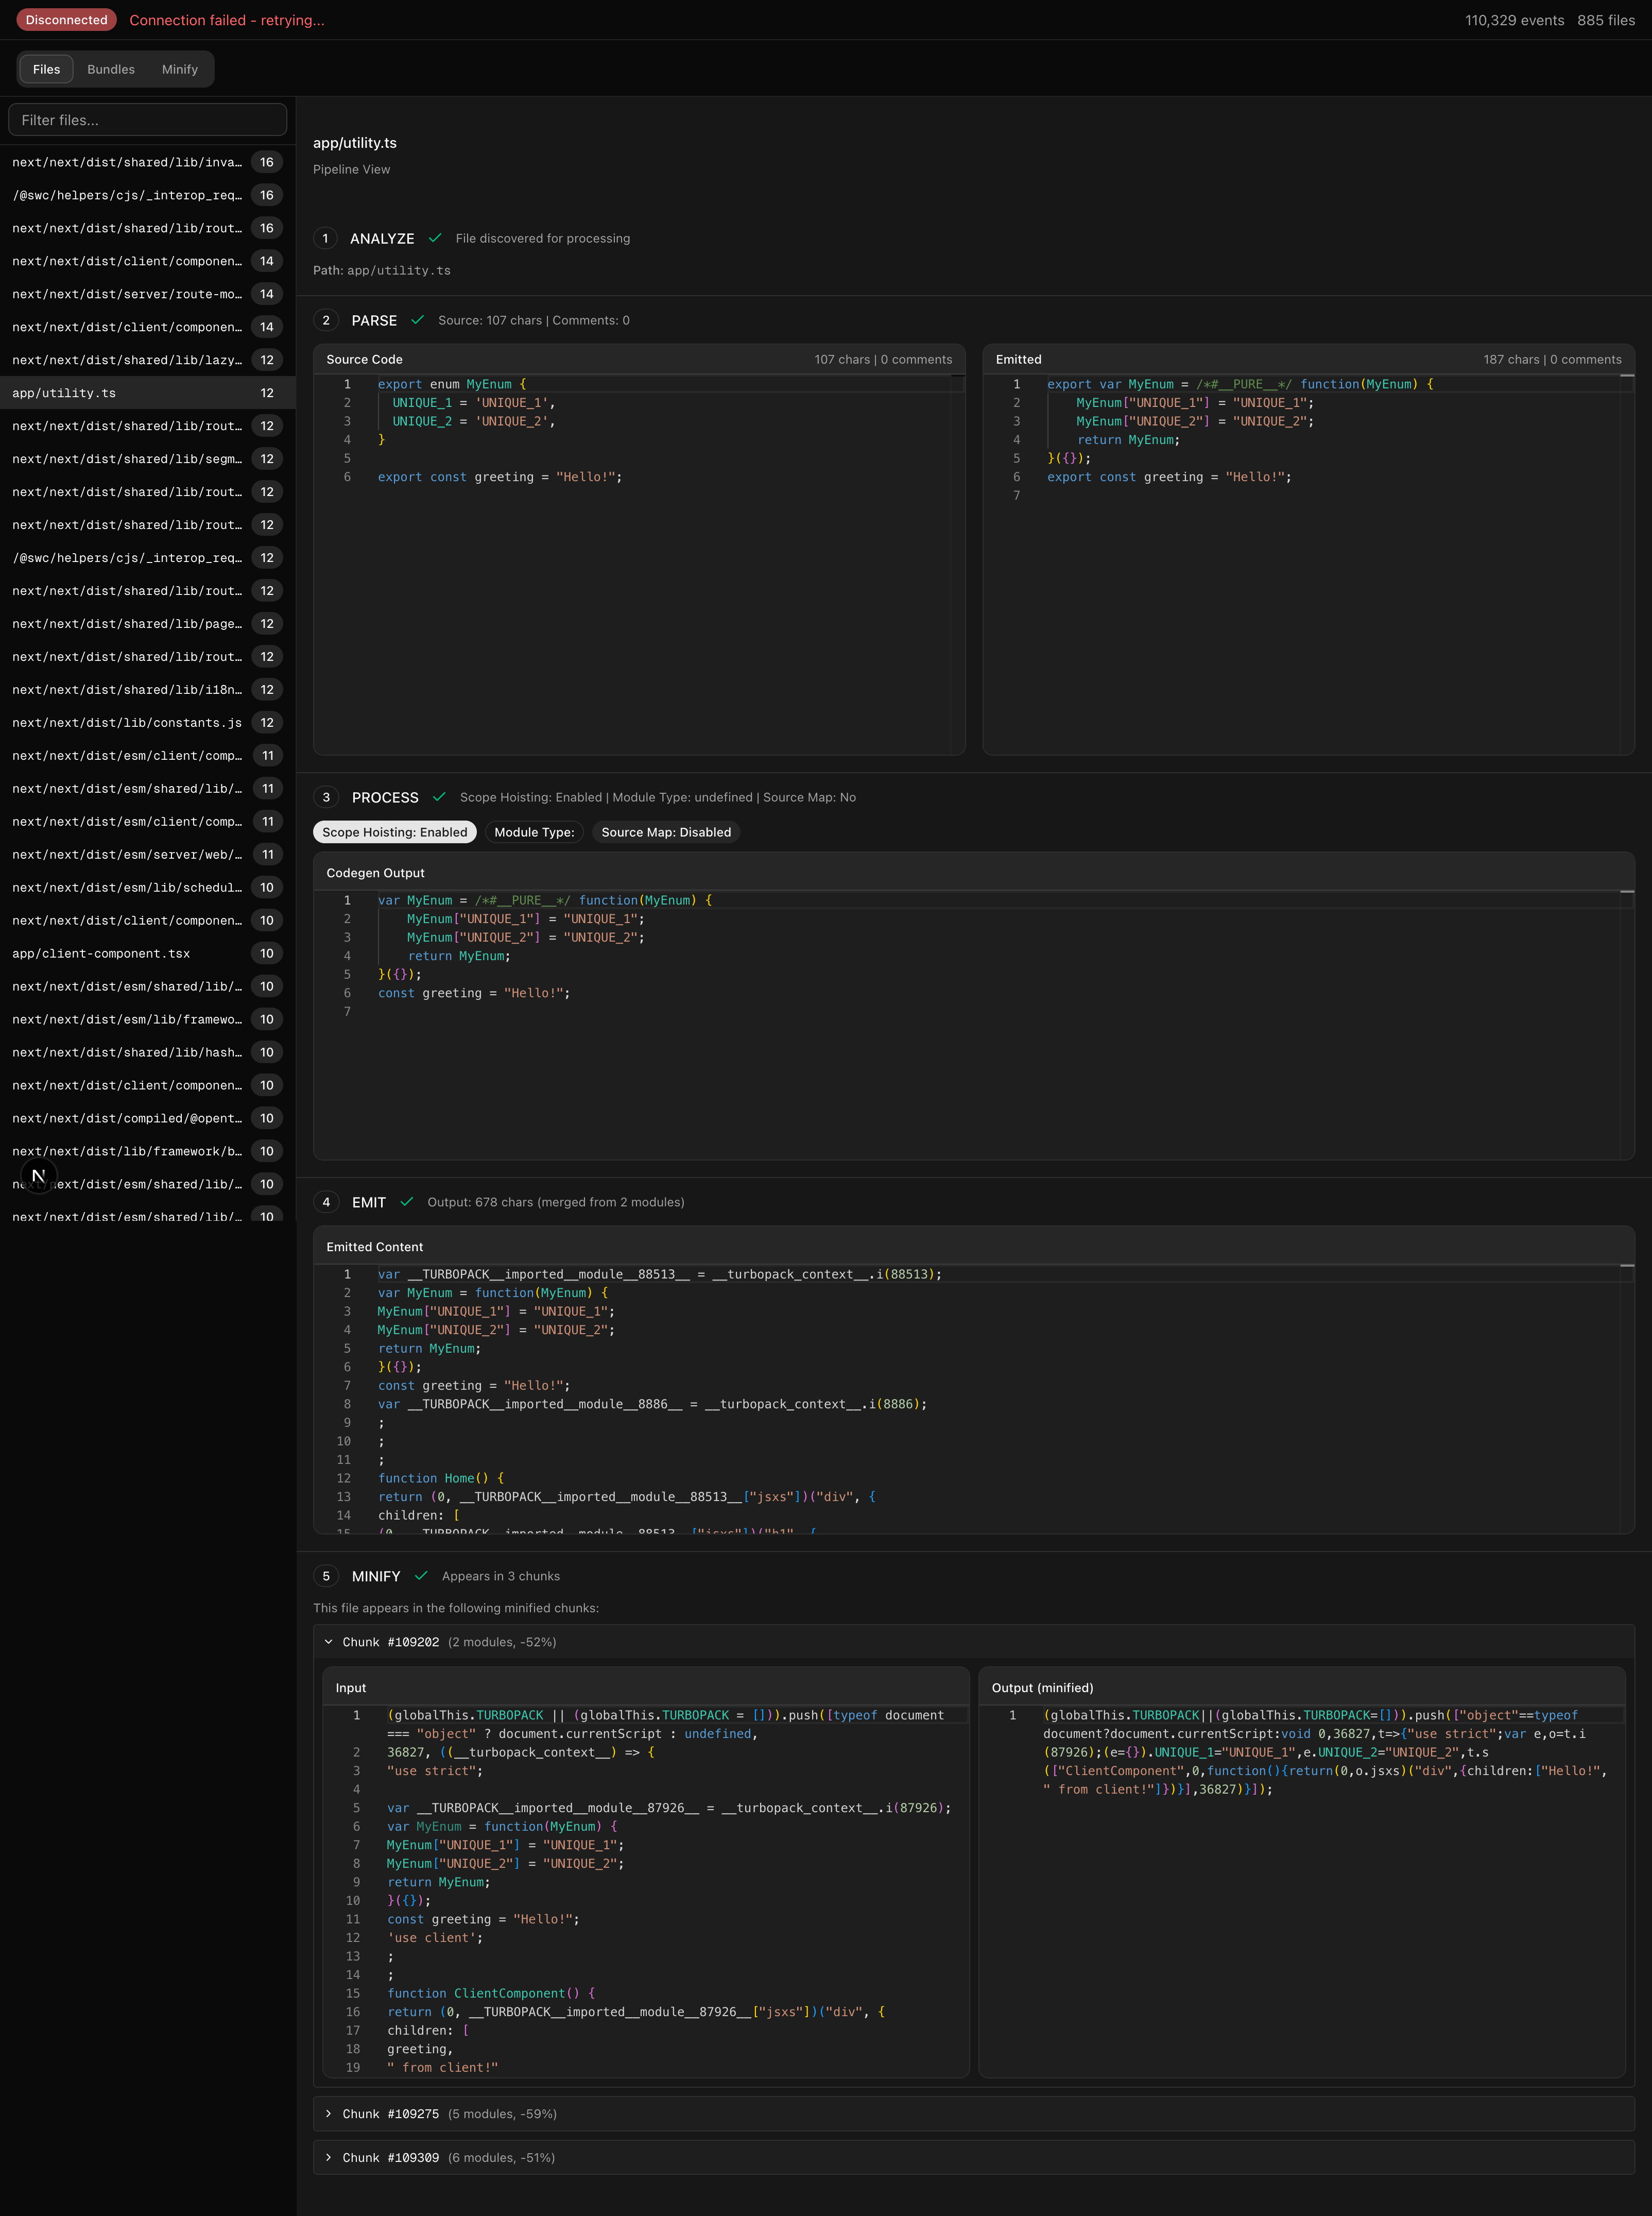
If we take a look, we can see our code step through the process. And ultimately end up in the bundle despite not being used. If you notice, though, between steps 3 and 4, our code changed a bit. We lost this PURE annotation. Why?
Luckily, because we tried to capture as much context as we could. We can see that a boolean "Scope Hoisting" has been enabled. Could that be related? If we turn it off, we instead see:
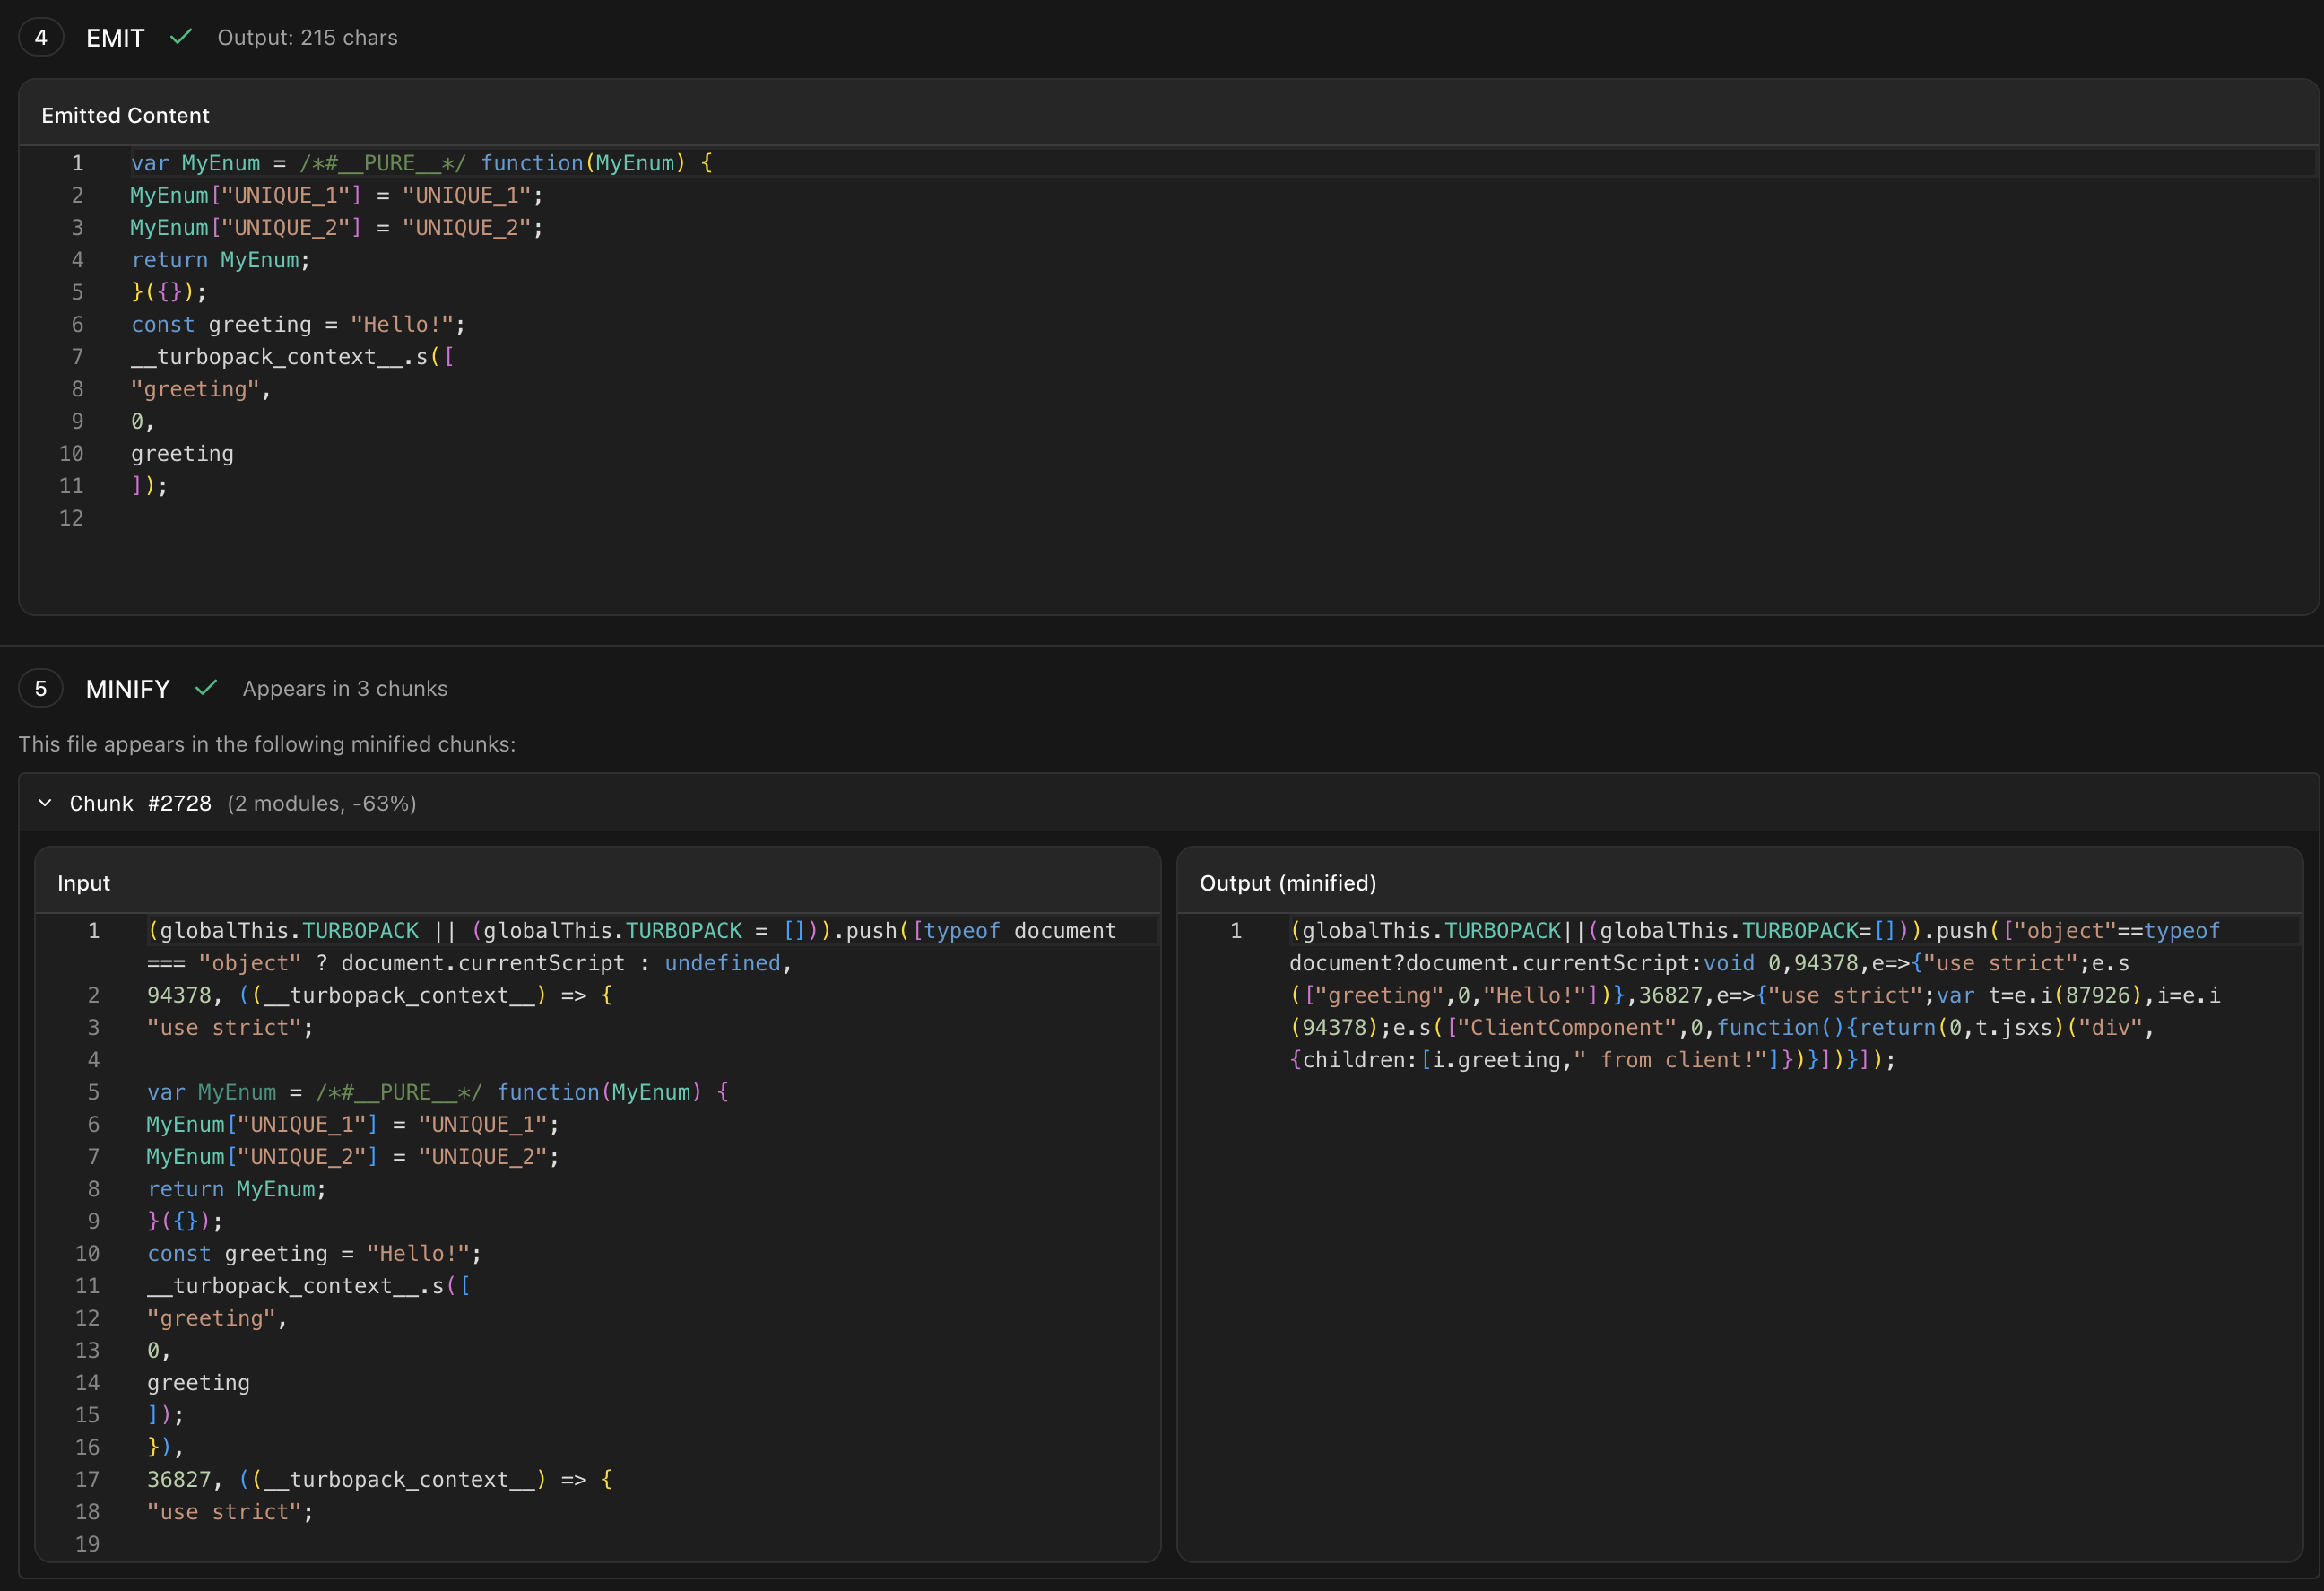
Our pure annotation is kept around, and as a result, our code is eliminated. If we take a step back, this can make sense. Something during the parse step is creating a closure around our enum code, but when it does so, it is marking that as a "pure" closure, meaning it has no side effects. Later, because this annotation is dropped, the minifier doesn't know that it can just get rid of this closure. As I've been trying to find time to write this up, it seems that people on the bug report have found this on their own as well.
Fixing the Bug#
So we've found the behavior of the bug. Now we need to understand why it is happening. Remember, we are fixing a bug as a means of understanding the software. Not just to fix a bug. So what exactly is going on? Well, we are trying to stitch together two libraries. Software bugs are way more likely to occur on these seams. In this case, after reading the code for a while, the problem becomes apparent.
SWC parses our code and turns it into an AST. But if you take a look at an AST, comments are not a part of the AST. So instead, SWC stores comments off in a hashmap where we can look them up by byte pos. So for each node in the AST, it can see if there is a comment attached. But for the PURE comment, it doesn't actually need to look this comment up. It is not a unique comment that was in the source code. It is a pre-known meta comment. So rather than store each instance in the map, it makes a special value.
/// Reserved for PURE comments. e.g. `/* #__PURE__ */`
pub const PURE: Self = BytePos(u32::MAX - 1);
Now, this encoding scheme causes some problems for turbopack. Turbopack does not act on a single file; it acts across many files. In fact, for scope hoisting, we are trying to take files across modules and condense them into a single scope. So now, when we encounter one of these bytepos encodings, how do we know what module it belongs to?
The obvious answer to many might be to simply make a tuple like (ModuleId, BytePos), and while that certainly works, it does come with tradeoffs. One of these is memory footprint. I didn't find an exact reason. But given the focus on performance on turbopack, I'd imagine this is one of the main motivations. Instead, we get a fairly clever encoding of module and bytepos into a single BytePos, aka a u32. I won't get into the details of the representation here; it involves some condition stuff. But needless to say, now that we are going from something focusing on one file to focusing on multiple and trying to smuggle in this module_id into our BytePos, we ended up missing one detail, PURE. Now our pure value is being interpreted as some module at some very high position instead of the proper bytes.
To fix this bug, I found the minimal fix was simply the following:
-        if pos.is_dummy() {
+        if pos.is_dummy() || pos.is_pure() {
             // nothing to encode
             return Ok(pos);
         }
With this our enum properly is marked as PURE and disappears from the output!
Now remember, we aren't trying to make a bug fix. We are trying to understand the codebase. Is this the right fix? I'm not sure. I looked around the codebase, and there are a number of other swc sentinel values that I think need to also be handled (PLACEHOLDER and SYNTHESIZED). There is also the decoding path. For dummy, the decoding path panics. Should we do the same? Should we be handling pure at a higher level, where it never even goes through the encoder?
Update: As I was writing this, someone else proposed a fix. As I was writing the article, I did see that others had started to figure out the things I had determined from my investigation. But I was not confident enough that it was the right fix yet. In fact, the PR differs a bit from my local fix. It does handle the other sentinel, but at a different layer. It also chooses to decode with module 0. Which felt a bit wrong to me. But again, these are decisions that people who work on this codebase long-term are better equipped to decide than me.
I'm Still Lost#
I must admit that simply fixing this bug didn't quite help me understand the codebase. Not just because it is a fairly good size. But because I couldn't see this fundamental unit that everything was composed of. In some of the code snippets above, you will see types that mention Vc. This stands for ValueCell. There are a number of ways to try to understand these; you can check out the docs for turbo engine for some details. Or you can read the high-level overview that skips the implementation details for the most part. You can think of these cells like the cells in a spreadsheet. They provide a level of incremental computation. When the value of some cell updates, we can invalidate stuff. Unlike a spreadsheet, the turbo engine is lazy.
I've worked with these kinds of systems before. Some were very explicitly modeled after spreadsheets. Others were based on rete networks or propagators. I am also immediately reminded of salsa from the Rust analyzer team. I've even worked with big, complicated non-computational graphs. But even with that background, I know myself, I've never been able to really understand these things until I can visualize them. And while a general network visualizer can be useful (and might actually be quite useful if I used the aggregate graph), I've found that for my understanding, I vastly prefer starting small and exploring out the edges of the graph. So that's what I did.
A General Visualizer#
But before we get to that visualization, I want to highlight something fantastic in the implementation: a central place for controlling a ton of the decisions that go into this system. The backend here lets us decide so many things about how the execution of our tasks will run. Because of this, we have one place we can insert a ton of tooling and begin to understand how this system works.
As before, we are going to send things on a WebSocket. But unlike last time, our communication will actually be two-way. We are going to be controlling how the tasks run.
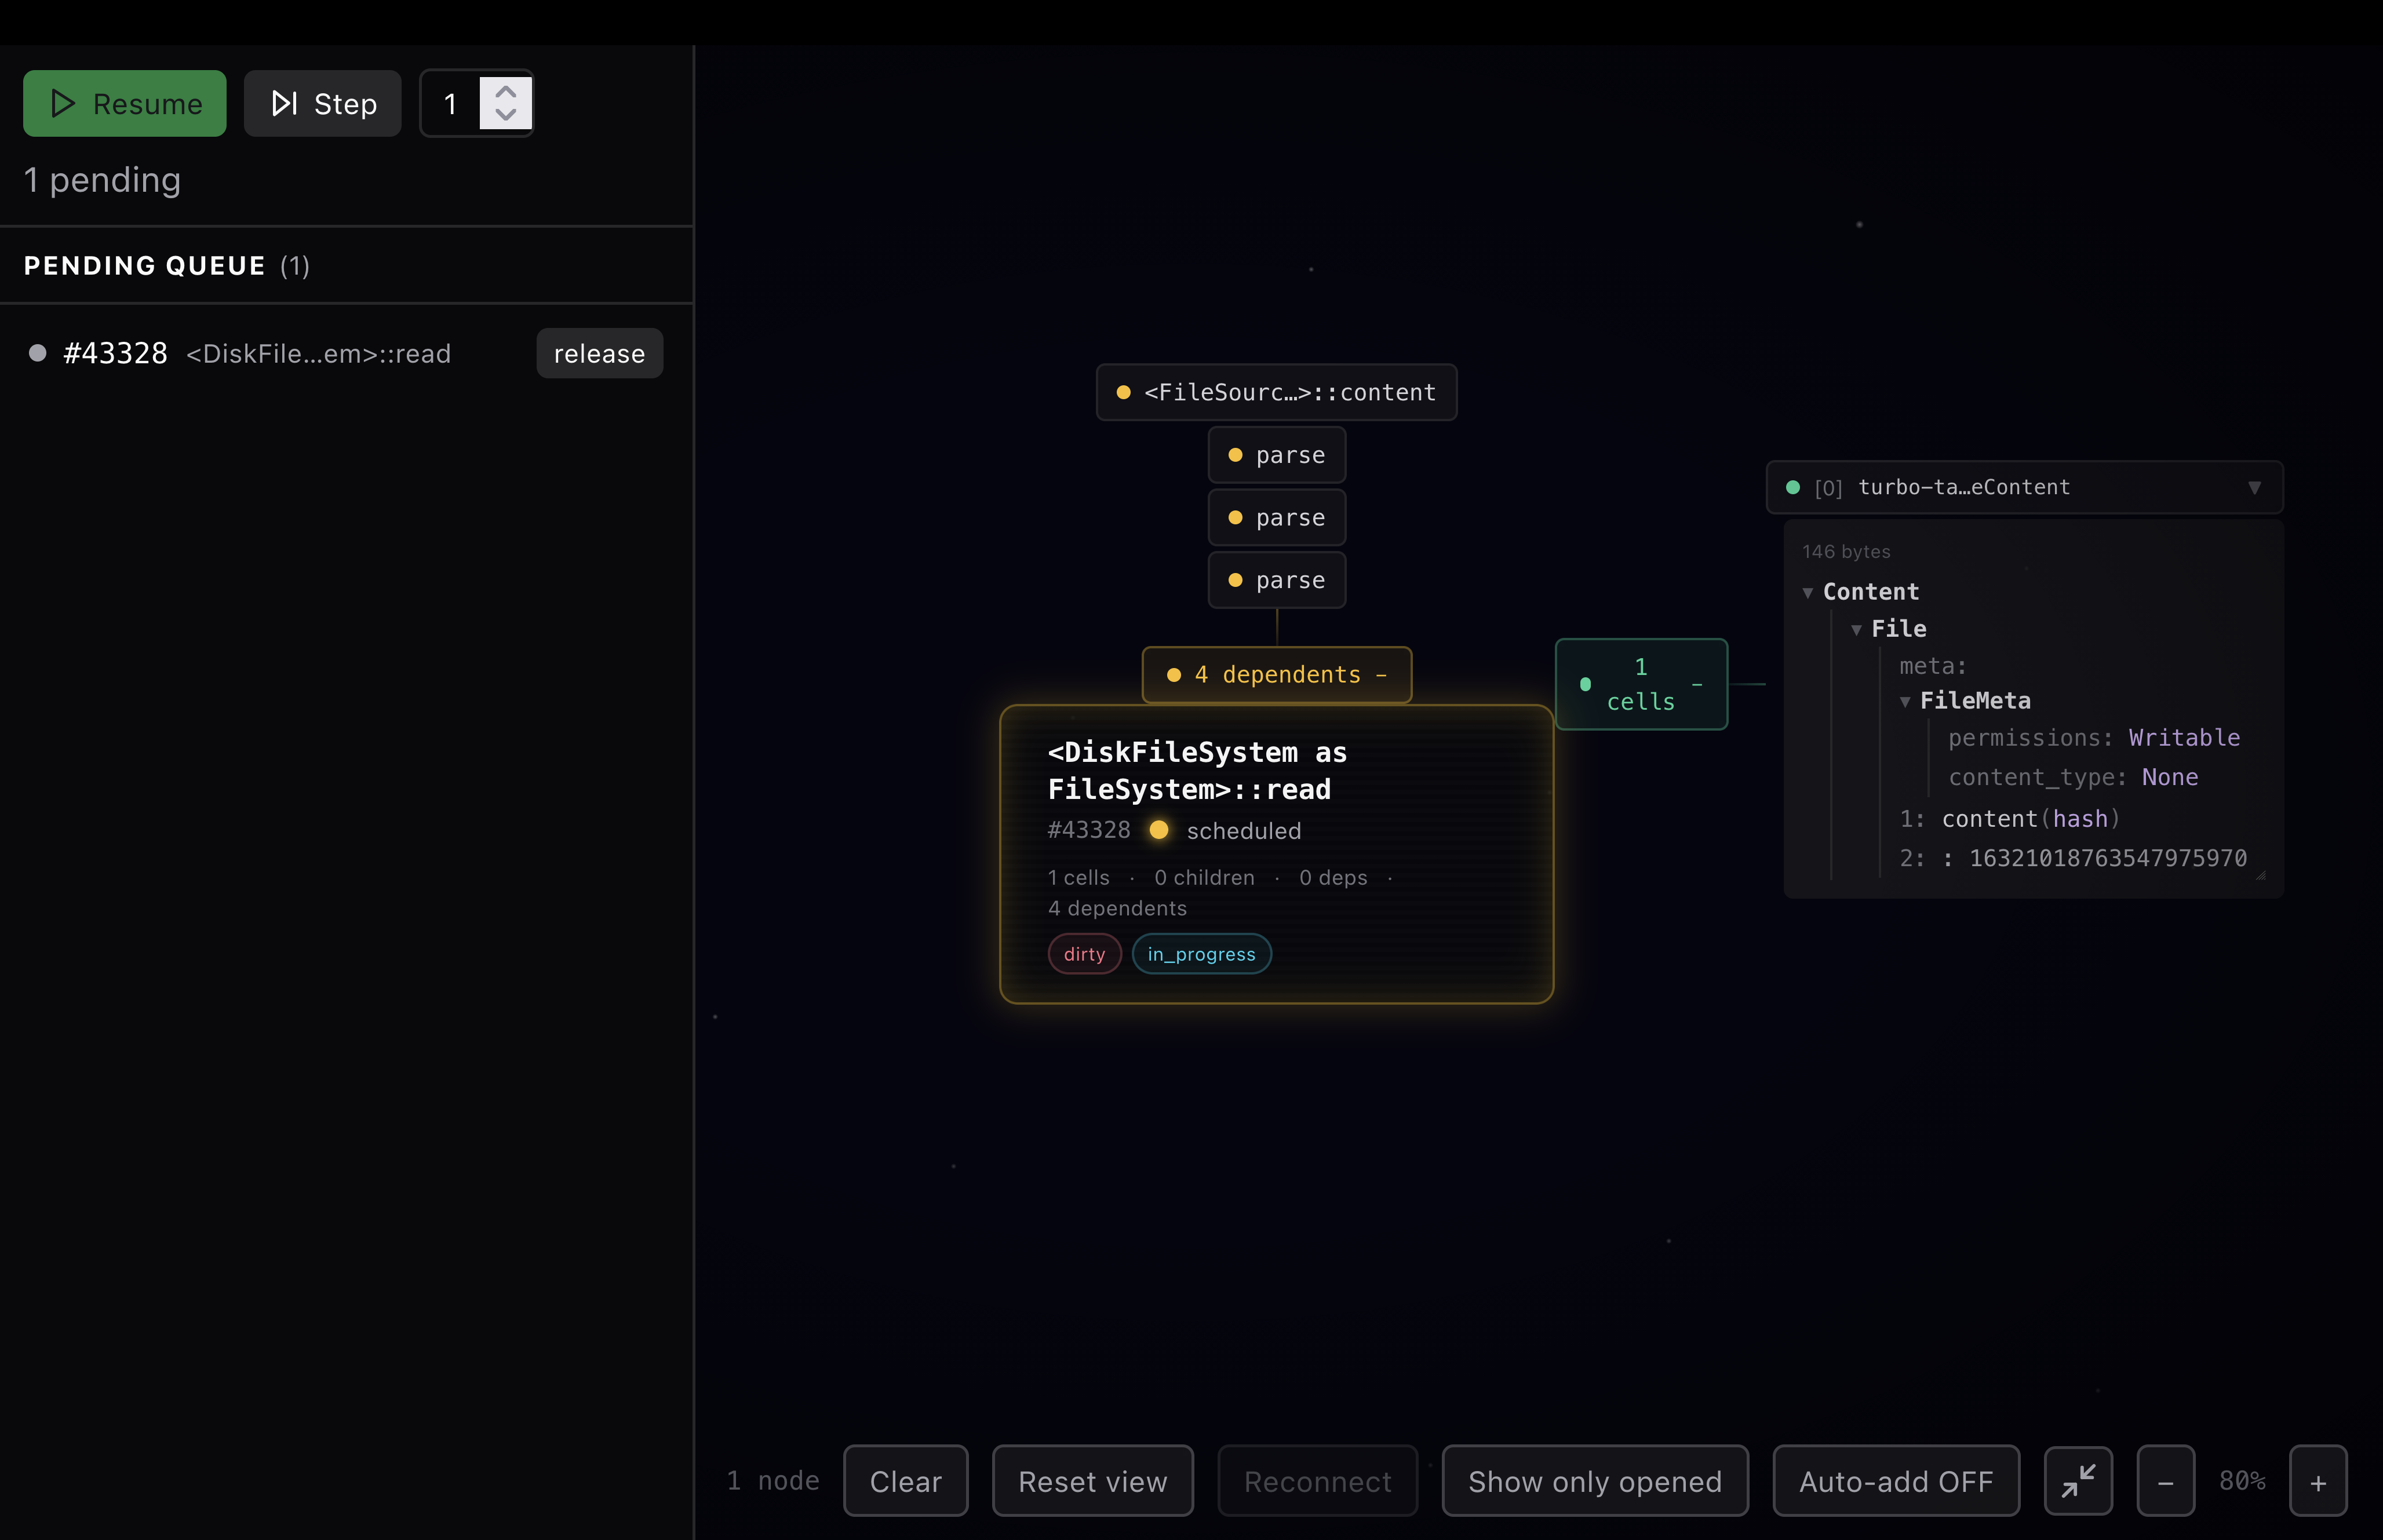
In my little test project, I edited a file, and my visualizer displayed the following. Admittedly, it is a bit janky, but there are some nice features. First, on the left, we can see all the pending tasks. In this case, something has marked our file read as dirty, so we are trying to read the file. We can see the contents of a cell that this task has. And we can see the dependents of this task.
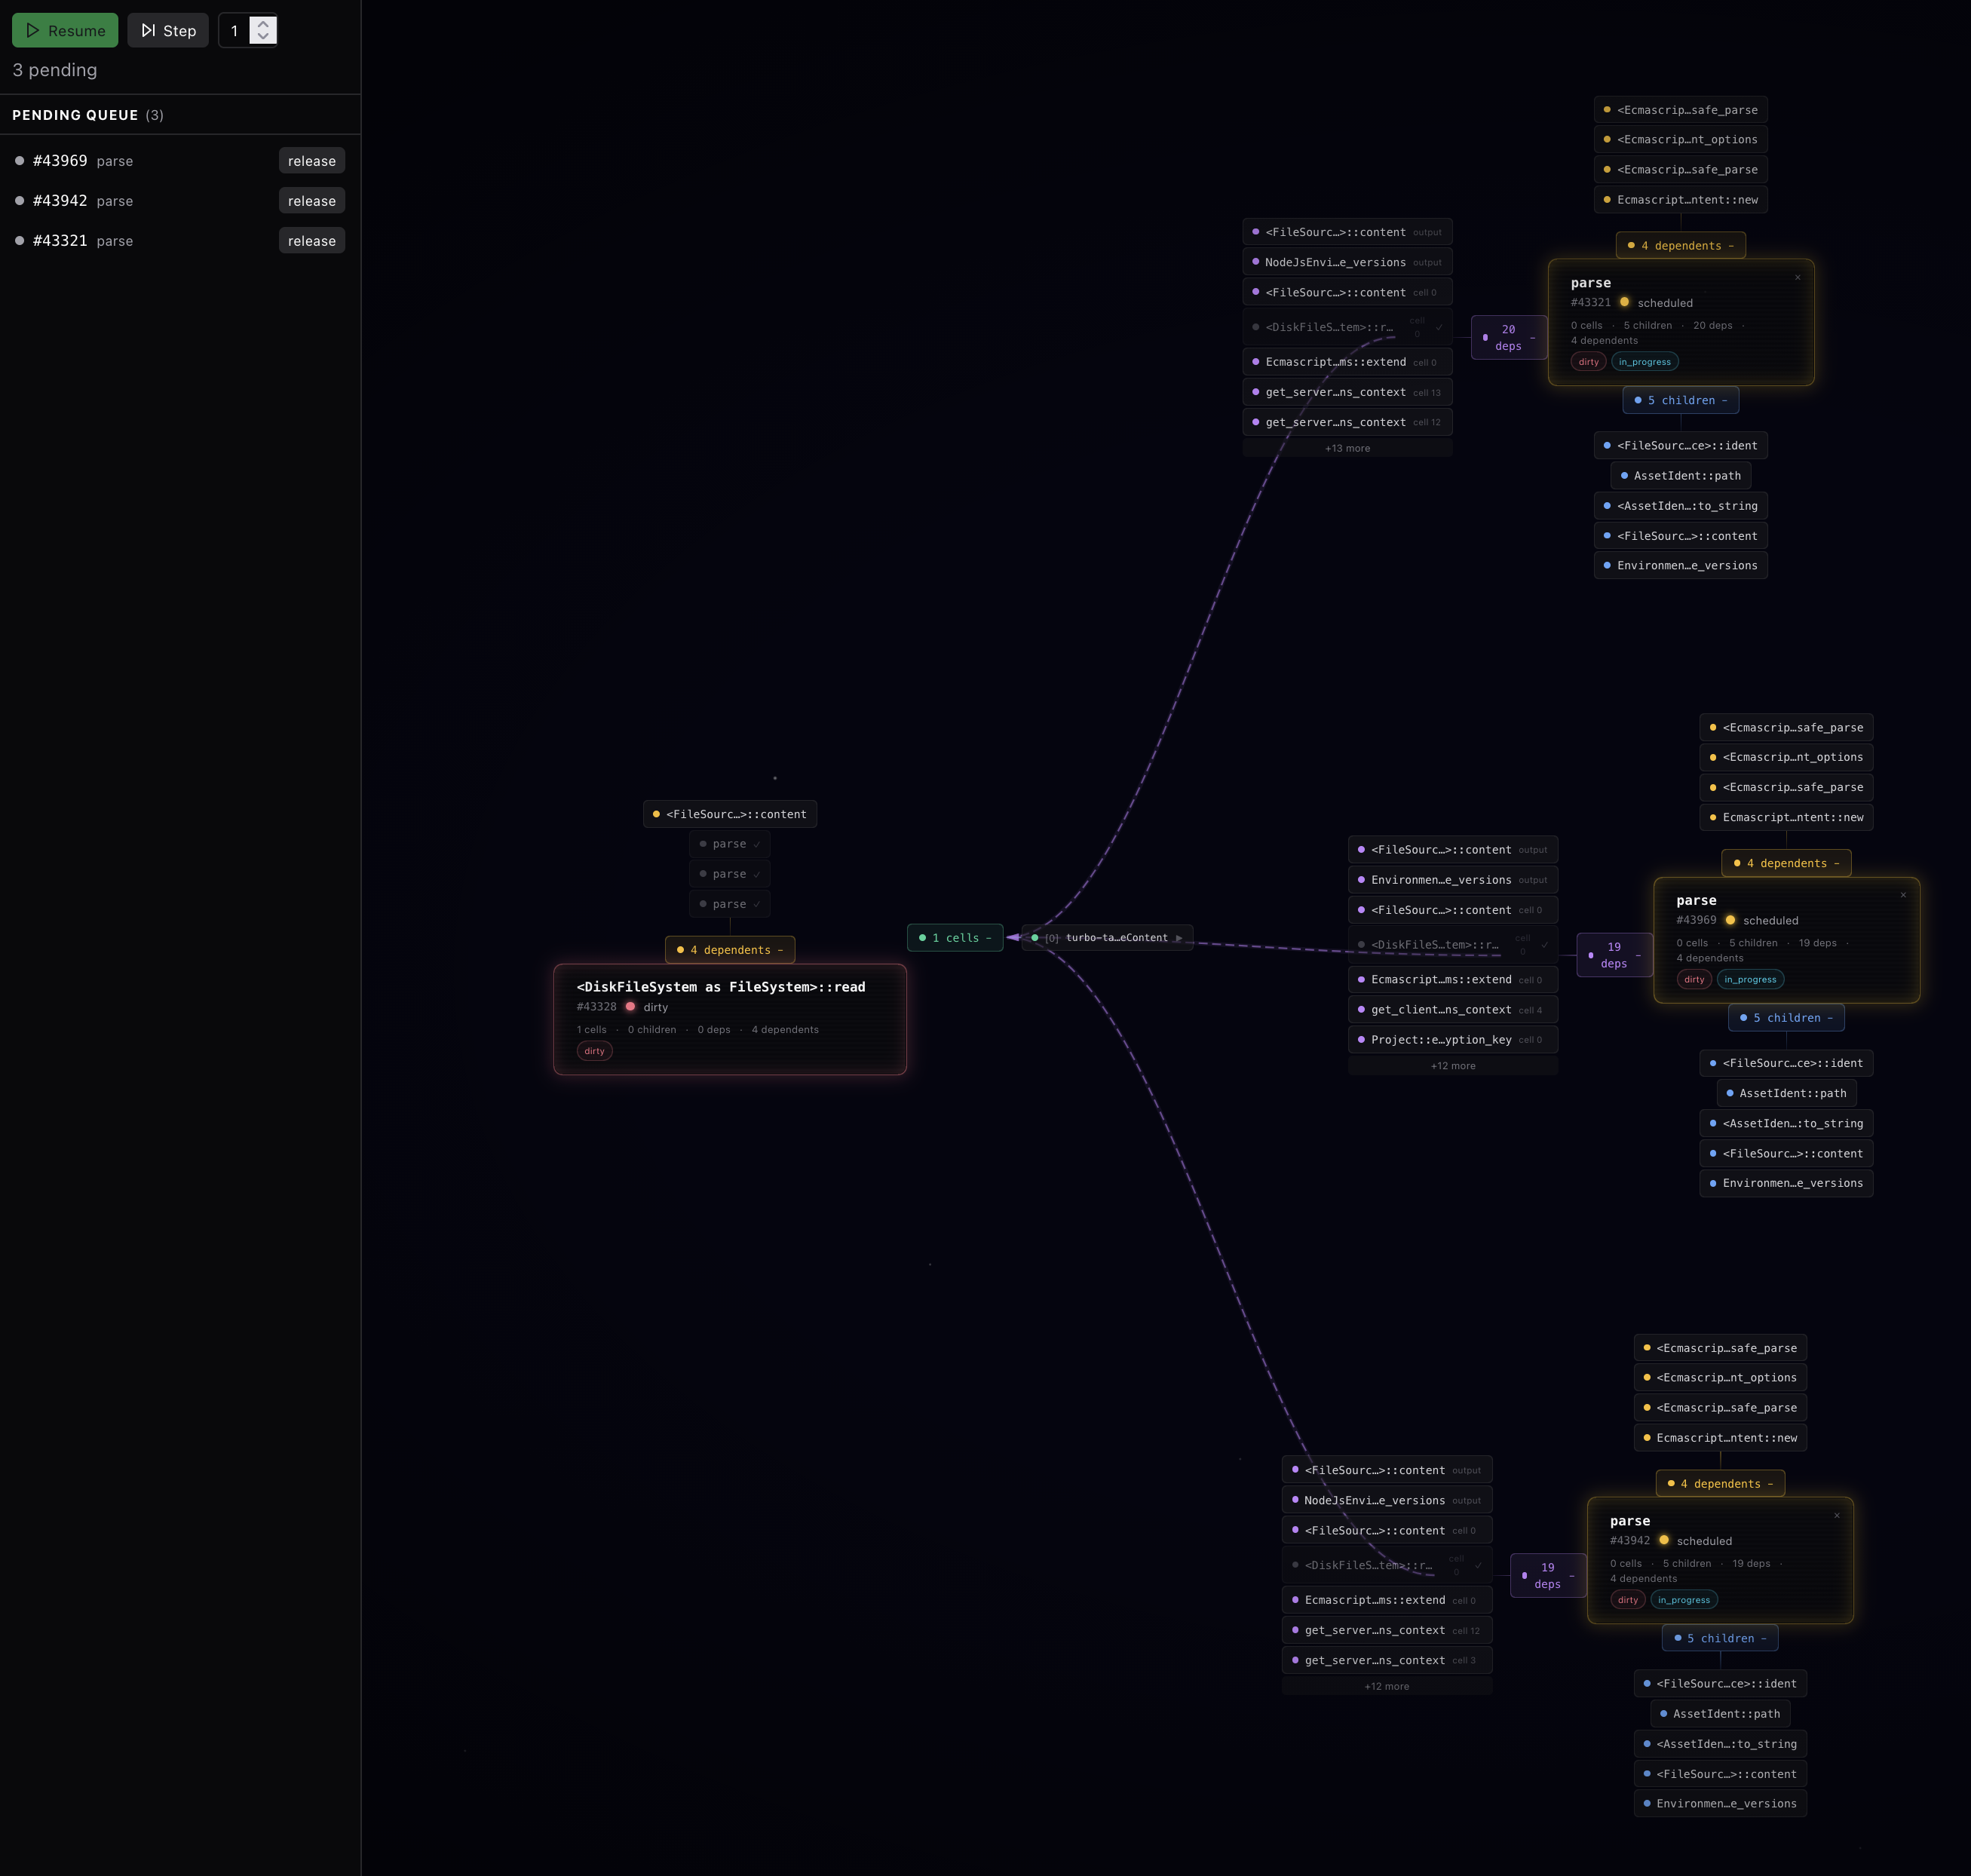
Here is what it looks like once we release that task to run. We can now see 3 parse tasks have kicked off. Why 3? I'll be honest, I haven't looked into it. But a good visualization is about provoking questions, not only answering them. Did I get my visualization wrong because I misunderstood something about the system? Are there three different subsystems that want to parse, and we want to do them in parallel? Have we just accidentally triggered more parses than we should be?
This is precisely what we want out of a visualizer. Is it perfect? No, would I ship this as a general visualizer? No. Am I happy with the style? Not in the least. But already it enables a look into the project I couldn't see before. Here we can actually watch the graph unfold as I execute more steps. What a fascinating view of a once opaque project.
With this visualizer, I was able to make changes to my project and watch values as they flow through the systems. I made simple views for looking at code. If I extended this, I can imagine it being incredibly useful for debugging general issues, for seeing the ways in which things are scheduled, and for finding redundancies in the graph. Once I was able to visualize this, I really started to understand the codebase better. I was able to see all the values that didn't need to be recomputed when we made changes. The whole thing clicked.
Conclusion#
This was an exercise in exploring a new codebase that is a bit different of a process than I see others take. It isn't an easy process, it isn't quick. But I've found myself repeating this process over and over again. For the turborepo codebase, this is just the beginning. This exploration was done over a few weekends in the limited spare time I could find. But already I can start to put the big picture together. I can start to see how I could shape my tools to help me answer more questions. If you've never used tool building as a way to learn a codebase, I highly recommend it.
Coda: A Call for More Interactive Dynamic Systems#
One thing I always realize as I go through this process is just how hard it is to work interactively with our current software. Our languages, our tools, our processes are all written without ways to live code, without ways to inspect their inner workings.
It is also incredibly hard to find a productive UI environment for this kind of live exploration. The running state of the visualizer contains all the valuable information. Any system that needs you to retrace your steps to get the UI back to the state it was once in to visualize more is incredibly lacking. So I always find myself in the browser, but immediately, I am having to worry about performance. We have made massive strides in so many aspects of software development. I hope that we will fix this one as well.
1. Vercel has an official trace viewer for turbopack, but it is focused on performance profiling rather than understanding how code flows through the system. ↩